
Beginner's Guide on What is ML, Simple Linear Regression And useful terms??
The "Hello world of ML"


Table of contents
- What is Machine Learning🤖:
- The most basic and fundamental algorithm is "Linear Regression"
- Before getting into the more details of the Linear Regression Algorithm we need to understand the terminology in this field of study.
- What are cost functions?
- Formulating the cost function
- What is Gradient Descent??
- Different Types Of Gradient Descent are:
- Underfitting and Overfitting
- Underfitting :
- Overfitting :
- What is linear regression? 🤔
- Simple Example Linear Regression.
- Applications of Linear Regression 📈
What is Machine Learning🤖:
Machine Learning (ML) comes under the broader umbrella of Artificial Intelligence(AI) in which the model is trained on existing and then used for prediction of future events. That the most basic use of ML today more complex uses would involve using ML at speed camera, Disease Diagnosis and more.
Today ML is booming and the need for professional in this domain is becoming a need so to get into this field of study you need to first understand some basics and follow a concrete path and understand some basic terminology and how things work.
ML Roadmap
You can check this roadmap and get more in depth idea on how to find your way in this domain.
The most basic and fundamental algorithm is "Linear Regression"
Before getting into the more details of the Linear Regression Algorithm we need to understand the terminology in this field of study.
What are cost functions?
In order to judge which lines fit better, we need a way to quantify the lines' performance. For example, consider the following two lines:
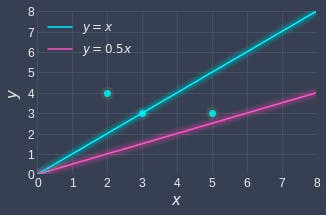
Intuitively, we can tell that the blue line fits our data points better than the red line because the blue line is relatively closer to the data points.
By convention in machine learning, the performance of a model is based on how inaccurate it is, rather than how accurate it is. For linear regression, this means that we want to measure how far off a model's fitted points are from the true data points. A line that is only off by a small amount implies that the line does an excellent job at modeling the data points.
Now, instead of talking about the performance of a model in abstract terms, we want to come up with a mathematical expression to quantify this notion of how off the model is. In machine learning, this expression is known as the cost function.
Cost functions play a central role in machine learning, and they capture how inaccurate a model is. A high value for the cost function means that the model is performing badly, while a low value means that the model is performing well. The objective then is to find a line that minimizes the cost function.
Formulating the cost function
For linear regression, the cost function is easy to derive - all we have to do is to compute the distances between our data points and the corresponding points on the fitted line, and then sum them up. Using our previous example, this means that we need to compute the sum of the red dashed lines as well as the sum of the blue dashed lines: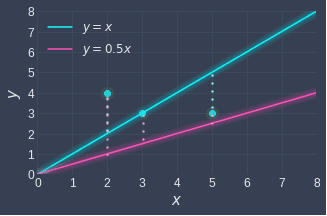 Mathematically, this involves computing a metric called the sum of squared errors (SSE):
$$J\;=\;\frac12\sum_{i=1}^m{(y_i-{\overset\frown y}_i)}^2$$
Where:
Mathematically, this involves computing a metric called the sum of squared errors (SSE):
$$J\;=\;\frac12\sum_{i=1}^m{(y_i-{\overset\frown y}_i)}^2$$
Where:
J is the cost function, which represents the quantity we want to minimize
m is the number of data points ( in this case)
y is the value of the -th data point (e.g. )
y^ is the fitted value of the -th data point (e.g. for the red fitted line)
Formulating the cost function is only half the battle won - we now need to compute the parameters of the model that minimize the cost function.
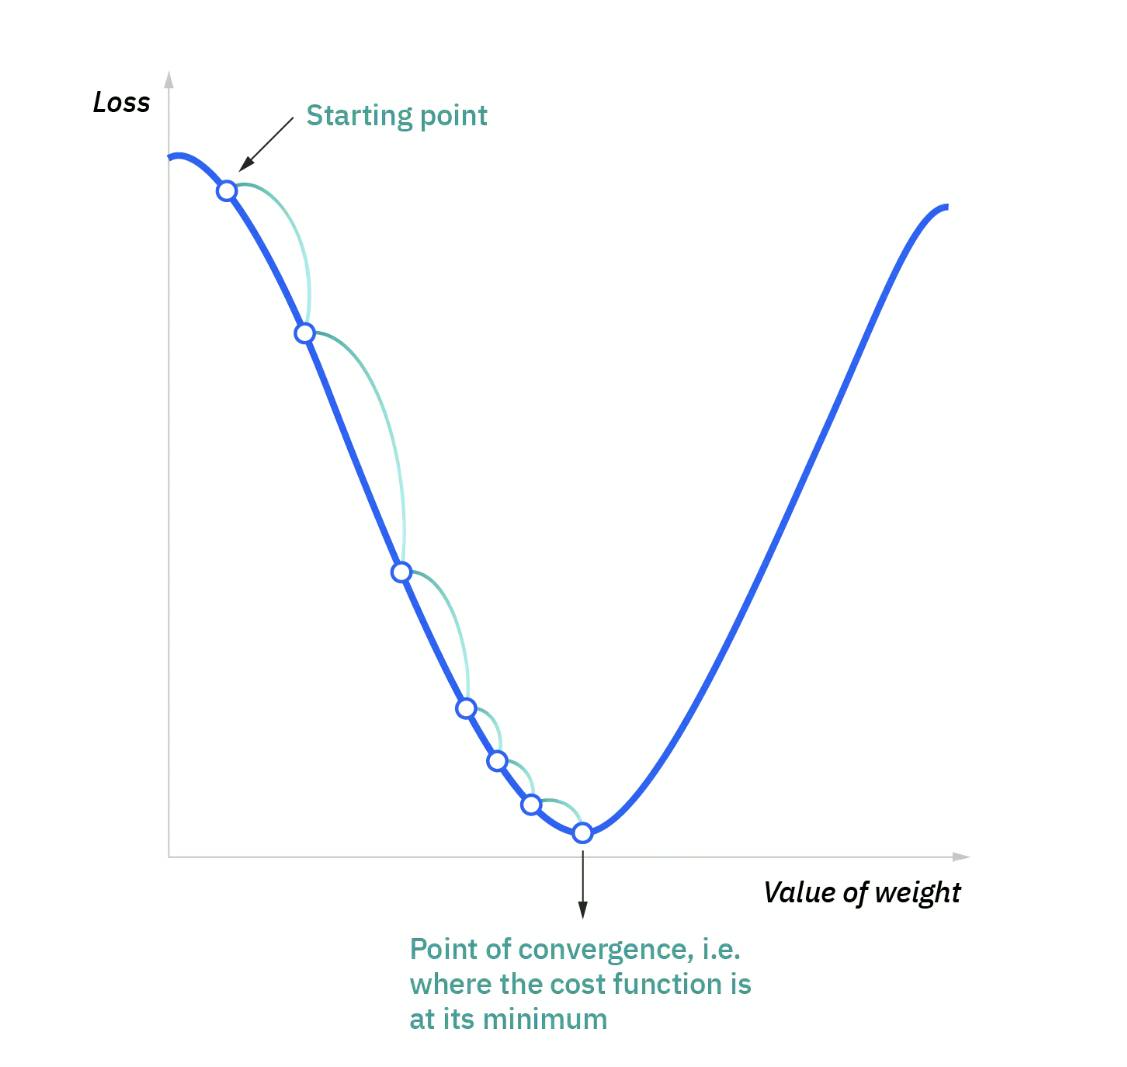
What is Gradient Descent??
Gradient descent is an optimization algorithm used to find the values of parameters (coefficients) of a function (f) that minimizes a cost function (cost).
Gradient descent is best used when the parameters cannot be calculated analytically (e.g. using linear algebra) and must be searched for by an optimization algorithm.
Different Types Of Gradient Descent are:
Batch gradientt: Batch Gradient descent sums the error for each point in a training set, updating the model only after all training examples have been evaluated. This process referred to as a training epoch. Batch gradient descent also usually produces a stable error gradient and convergence, but sometimes that convergence point isn’t the most ideal, finding the local minimum versus the global one.
Stochastic gradient descent (SGD):
This runs a training epoch for each example within the dataset and it updates each training example's parameters one at a time. Since you only need to hold one training example, they are easier to store in memory. While these frequent updates can offer more detail and speed, it can result in losses in computational efficiency when compared to batch gradient descent.
Its frequent updates can result in noisy gradients and more use of memory.
Mini-batch gradient descent: Mini-batch gradient descent combines concepts from both batch gradient descent and stochastic gradient descent. It splits the training dataset into small batch sizes and performs updates on each of those batches. This approach strikes a balance between the computational efficiency of batch gradient descent and the speed of stochastic gradient descent.
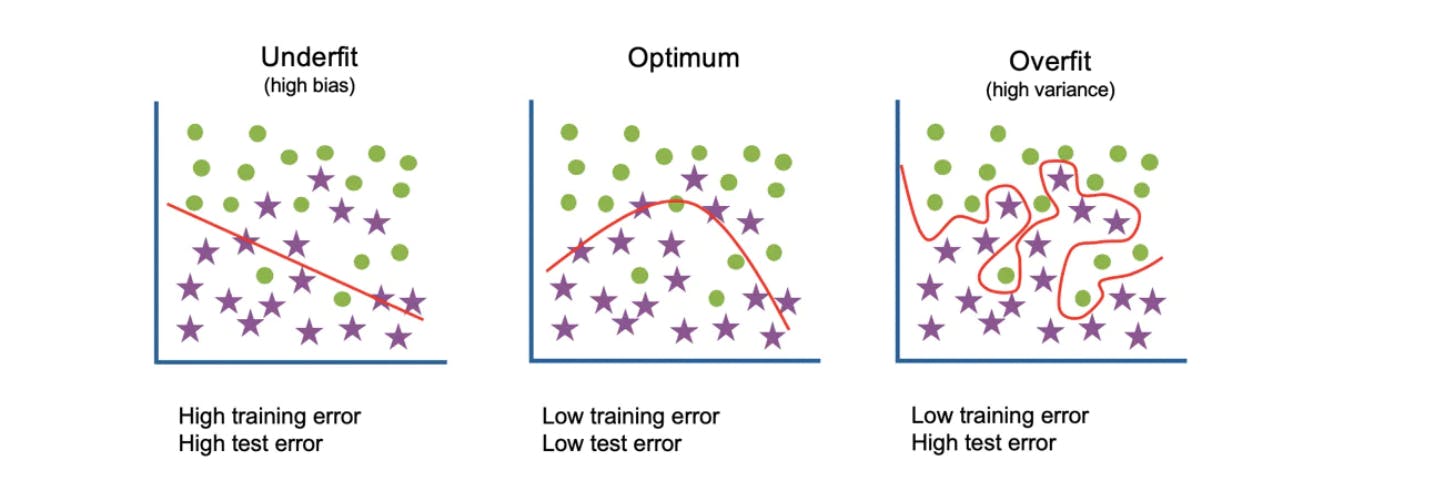
Underfitting and Overfitting
When we talk about the Machine Learning model, we actually talk about how well it performs and its accuracy which is known as prediction errors.A model is said to be a good machine learning model if it generalizes any new input data from the problem domain in a proper way this helps it to make right predictions.
For checking how well our model is and how good it learns and generalizes data.
For that, we have overfitting and underfitting, which are majorly responsible for the poor performances of the machine learning algorithms.
Before diving further let’s understand two important terms:
- Bias: Assumptions made by a model to make a function easier to learn. It is actually the error rate of the training data. When the error rate has a high value, we call it High Bias and when the error rate has a low value, we call it low Bias.
- Variance: The difference between the error rate of training data and testing data is called variance. If the difference is high then it’s called high variance and when the difference of errors is low then it’s called low variance. Usually, we want to make a low variance for generalized our model.
Underfitting :
Underfitting is a scenario in data science where a data model is unable to capture the relationship between the input and output variables accurately, generating a high error rate on both the training set and unseen data.High bias and low variance are good indicators of underfitting.
Overfitting :
Overfitting is a concept in data science, which occurs when a statistical model fits exactly against its training data. When this happens, the algorithm unfortunately cannot perform accurately against unseen data. Low error rates and a high variance are good indicators of overfitting
What is linear regression? 🤔
Linear regression is one of the most popular and simplest machine learning models that capture the relationship between two or more features. The objective of linear regression is to draw a line of best fit for performing predictions and inferences.
Linear regression has many practical uses. Most applications fall into one of the following two broad categories:
- If the goal is prediction, forecasting, or error reduction,[clarification needed] linear regression can be used to fit a predictive model to an observed data set of values of the response and explanatory variables. After developing such a model, if additional values of the explanatory variables are collected without an accompanying response value, the fitted model can be used to make a prediction of the response.
2.If the goal is to explain variation in the response variable that can be attributed to variation in the explanatory variables, linear regression analysis can be applied to quantify the strength of the relationship between the response and the explanatory variables
Simple Example Linear Regression.
Before starting the discussion on the math aspects or the code and everything lets understand the concept of simple linear regression using a simple example.
Suppose we have the following data points:
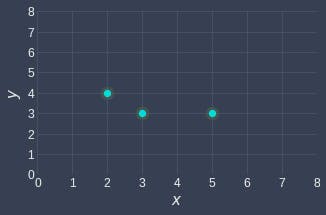 Let's start simple and build a linear regression model that goes through the origin. The objective therefore is to find a line of best fit that passes the origin.
This is the basic syntax for importing the model:
from sklearn.linear_model.LinearRegression import LinearRegression()
Different Types of Linear Regression are:
- Ridge Regression:
This model solves a regression model where the loss function is the linear least squares function and regularization is given by the l2-norm. Also known as Ridge Regression or Tikhonov regularization. This estimator has built-in support for multi-variate regression (i.e., when y is a 2d-array of shape (n_samples, n_targets)).
||y - Xw||^2_2 + alpha * ||w||^2_2
- Lasso Regression:
Linear Model trained with L1 prior as regularizer (aka the Lasso).
The optimization objective for Lasso is:
(1 / (2 n_samples)) ||y - Xw||^2_2 + alpha * ||w||_1
Technically the Lasso model is optimizing the same objective function as the Elastic Net with l1_ratio=1.0 (no L2 penalty).
Applications of Linear Regression 📈
- Finance
The capital asset pricing model uses linear regression as well as the concept of beta for analyzing and quantifying the systematic risk of an investment. This comes directly from the beta coefficient of the linear regression model that relates the return on the investment to the return on all risky assets. - Economics
Linear regression is the predominant empirical tool in economics. For example, it is used to predict consumption spending, fixed investment spending, inventory investment, purchases of a country's exports, spending on imports, the demand to hold liquid assets, labor demand, and labor supply. - Trend line
A trend line represents a trend, the long-term movement in time series data after other components have been accounted for. It tells whether a particular data set (say GDP, oil prices or stock prices) have increased or decreased over the period of timeTrend lines are sometimes used in business analytics to show changes in data over time.
This has the advantage of being simple.